Triangle Continuation Pattern Explained
It is a continuation pattern that occurs in both uptrends and downtrends. It represents market indecision between buyers and sellers, where the market moves within a narrow, contracting range during a period in which supply and demand forces are nearly equal. The pattern reflects a pause before the continuation of the previous trend
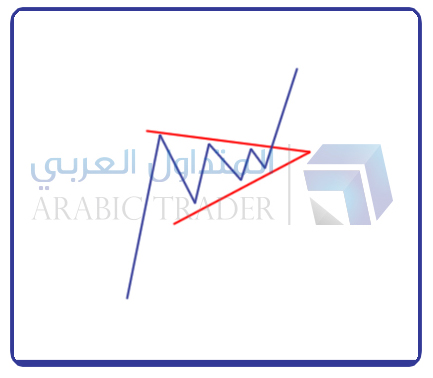
Pattern Shape:

Pattern Formation Stages:
In an uptrend, buyers attempt to push the price higher, but these attempts are met with resistance from sellers, and the opposite occurs in a downtrend
Each new peak or bottom forms within a narrower range than the previous one, and the pattern develops after several alternating movements between upward and downward price action, as illustrated in the pattern shape above
The pattern is then broken in the direction of the prior trend, and the price continues in that direction
Utilizing the Pattern:
In an uptrend: buy when the upper descending trendline forming the triangle is broken
In a downtrend: sell when the lower ascending trendline forming the triangle is broken
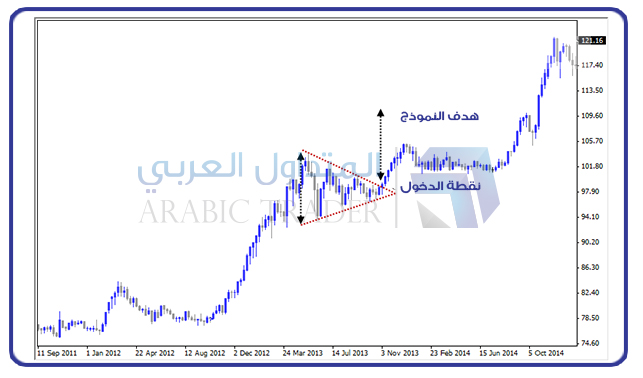
Pattern Target:
Measure the vertical distance from the widest part of the triangle, then project the same distance from the breakout point
Conclusion:
It is a continuation pattern that occurs in both upward and downward trends, representing a period of consolidation and indecision before the price resumes its previous direction
It indicates a temporary pause in the market before the price continues in the direction of the prevailing trend
-
24 Jun 08:30PM
![Mohammed Salah]()
Mohammed Salah - Member of the ArabicTrader Forums team, professional financial market analyst and expert in trading financial markets for 10 years.
Wednesday 24 June 08:30 PM
Free online
Register now -
29 Jun 08:30PM
![Yasser Mansour]()
Yasser Mansour - Business Development Manager at Just Markets
Monday 29 June 08:30 PM
Free online
Register now -
25 Dec 06:00PM
![Walid Aboeldahab]()
Walid Aboeldahab - ArabicTrader Senior Market Analyst, Certified Technical Analyst CFTe.
Friday 25 December 06:00 PM

.png)
