Double Bottom Pattern Explained
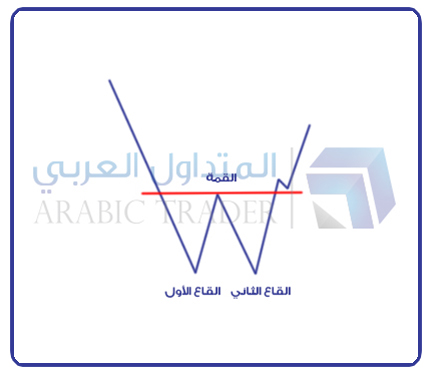
It is a reversal pattern that appears at the end of a downtrend, and it consists of two bottoms at the same horizontal level
Pattern Shape:
Pattern Formation Stages:
Near the end of the downtrend, buyers attempt to take control of price movement, causing the price to rise and form the first bottom. Then sellers regain control of the market, pushing the price downward to form a second bottom and reach the level of the first bottom
Sellers fail to break below the first bottom, and buyers take control, pushing the price upward from the second bottom. The peak is then broken, and the trend begins to reverse from downward to upward
Utilizing the Pattern:
The pattern can be utilized in trading by entering a buy position after the peak formed between the two bottoms is broken, or upon its retest
Pattern Target:
Measure the distance from the neckline to the two bottoms, then project the same distance upward from the breakout point

Conclusion:
It is a reversal pattern that appears at the end of a downtrend and consists of two bottoms formed at the same horizontal level, indicating a potential shift in market direction from bearish to bullish
It indicates a potential reversal from a downtrend to an uptrend after buyers gain control over price movement
-
24 Jun 08:30PM
![Mohammed Salah]()
Mohammed Salah - Member of the ArabicTrader Forums team, professional financial market analyst and expert in trading financial markets for 10 years.
Wednesday 24 June 08:30 PM
Free online
Register now -
29 Jun 08:30PM
![Yasser Mansour]()
Yasser Mansour - Business Development Manager at Just Markets
Monday 29 June 08:30 PM
Free online
Register now -
25 Dec 06:00PM
![Walid Aboeldahab]()
Walid Aboeldahab - ArabicTrader Senior Market Analyst, Certified Technical Analyst CFTe.
Friday 25 December 06:00 PM

.png)
