Double Top Pattern Explained
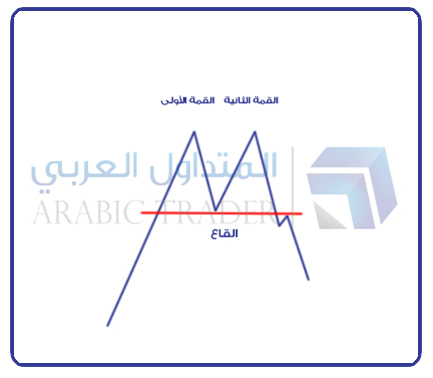
It is a reversal pattern that appears at the end of an uptrend, and it consists of two peaks at the same horizontal level
Pattern Shape:
Pattern Formation Stages:
Near the end of the uptrend, sellers attempt to take control of price movement, causing the price to decline and form the first peak. Then buyers regain control of the market, pushing the price upward to form a bottom and reach the level of the first peak
Buyers fail to break above the first peak, and sellers take control, pushing the price downward to form the second peak. The bottom is then broken, and the trend begins to reverse from upward to downward
Utilizing the Pattern:
The pattern can be utilized in trading by entering a sell position after the bottom formed between the two peaks is broken, or upon its retest
Pattern Target:
Measure the distance from the bottom to the peaks, then project the same distance downward from the breakout point

Conclusion:
It is a reversal pattern that appears at the end of an uptrend and consists of two peaks formed at the same horizontal level, indicating a potential shift in market direction from bullish to bearish
- It indicates a potential reversal from an uptrend to a downtrend after sellers gain control over price movement
-
07 Jul 08:30PM
![Wael Makarem]()
Wael Makarem - Chief Market Strategist at Exness
Tuesday 07 July 08:30 PM
Free online
Register now -
13 Jul 08:30PM
![Mohamed Gaber]()
Mohamed Gaber - Professional analyst and trading expert in financial markets for 12 years
Monday 13 July 08:30 PM
Free online
Register now -
14 Jul 08:30PM
![Mohammed Salah]()
Mohammed Salah - Member of the ArabicTrader Forums team, professional financial market analyst and expert in trading financial markets for 10 years.
Tuesday 14 July 08:30 PM
Free online
Register now

.png)
