Trendlines Explained
Trendline
A trendline is one of the most important tools in technical analysis. It is a straight line that connects two or more highs or lows and extends along price movement to represent a dynamic support or resistance level
Types of Trendlines:
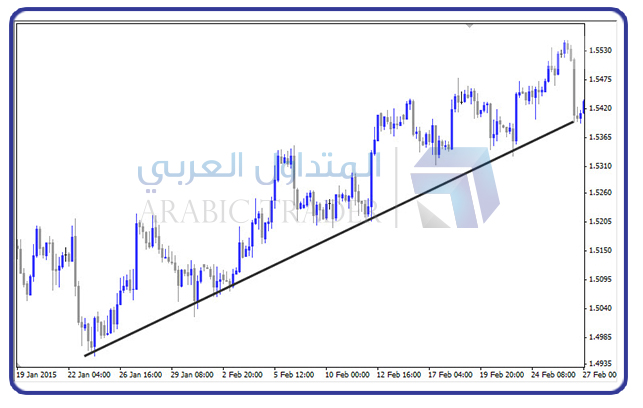
Uptrend Line: drawn below the price by connecting lows from left to right
Downtrend Line: drawn above the price by connecting highs from left to right
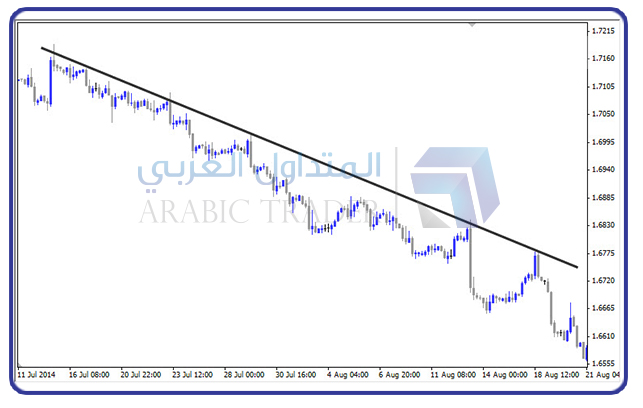
To draw a valid trendline, at least two touchpoints (two highs or two lows) are required. However, the trendline is not considered reliable unless a third point confirms it. After the third touch, the line can be used as a reference in future price analysis. It is also important that the line is drawn using candle wicks and does not cut through candle bodies
Trendline Breaks:
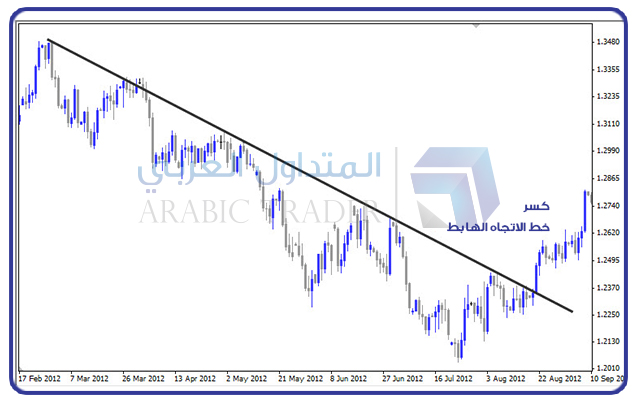
Trends do not last indefinitely, and price does not always respect the trendline. Just as support and resistance levels can be broken, trendlines can also be broken
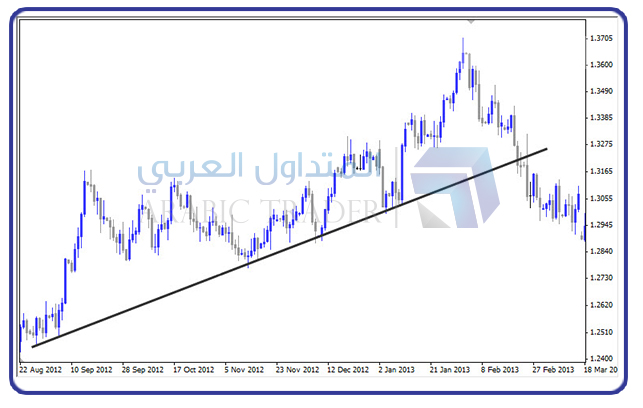
A break of a trendline is considered one of the first signals indicating the end of the current trend and the beginning of a new one. A break of an uptrend line suggests increasing selling pressure and a higher probability of a downward reversal, while the opposite applies in a downtrend
Role Reversal in Trendlines:
The concept of role reversal also applies to trendlines. When an uptrend line (support) is broken, it may act as resistance when the price returns to retest it. Conversely, when a downtrend line (resistance) is broken, it may act as support upon retest


Important Guidelines for Trendlines:
The reliability of a trendline increases as the duration of price adherence to it becomes longer
The more times price reacts to the trendline, the stronger and more reliable it becomes
The slope of the trendline should not be too steep or too flat. The ideal slope is moderate, typically close to a 45-degree angle
Conclusion:
Trendlines are essential tools for identifying market direction and dynamic support and resistance levels, helping traders anticipate trend continuation or reversal based on price behavior
A trendline is a straight line that connects price highs or lows to identify the direction of the market
-
24 Jun 08:30PM
![Mohammed Salah]()
Mohammed Salah - Member of the ArabicTrader Forums team, professional financial market analyst and expert in trading financial markets for 10 years.
Wednesday 24 June 08:30 PM
Free online
Register now -
29 Jun 08:30PM
![Yasser Mansour]()
Yasser Mansour - Business Development Manager at Just Markets
Monday 29 June 08:30 PM
Free online
Register now -
25 Dec 06:00PM
![Walid Aboeldahab]()
Walid Aboeldahab - ArabicTrader Senior Market Analyst, Certified Technical Analyst CFTe.
Friday 25 December 06:00 PM

.png)
